What lands in your folder.
Every page below is a real report format with the names and teams replaced by sample data. The layout, the math and the charts are what a coaching staff actually receives.
About these pages. Players, pitchers and schools are anonymized. Numbers come from deterministic code, and the written notes are generated from those computed values, then read by a person before delivery.
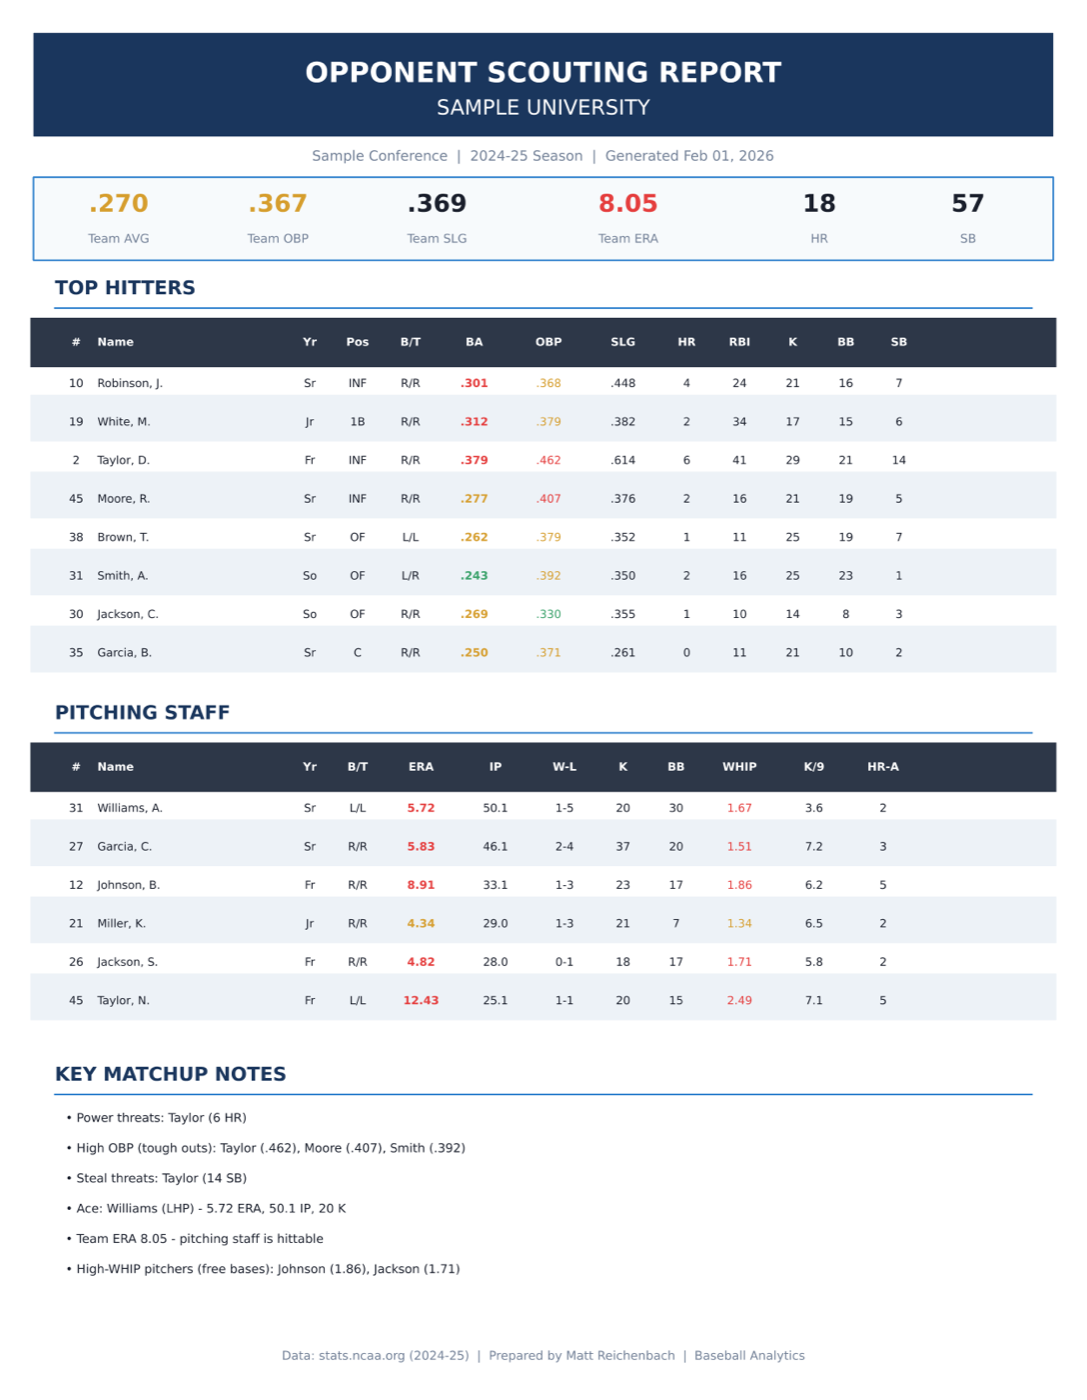
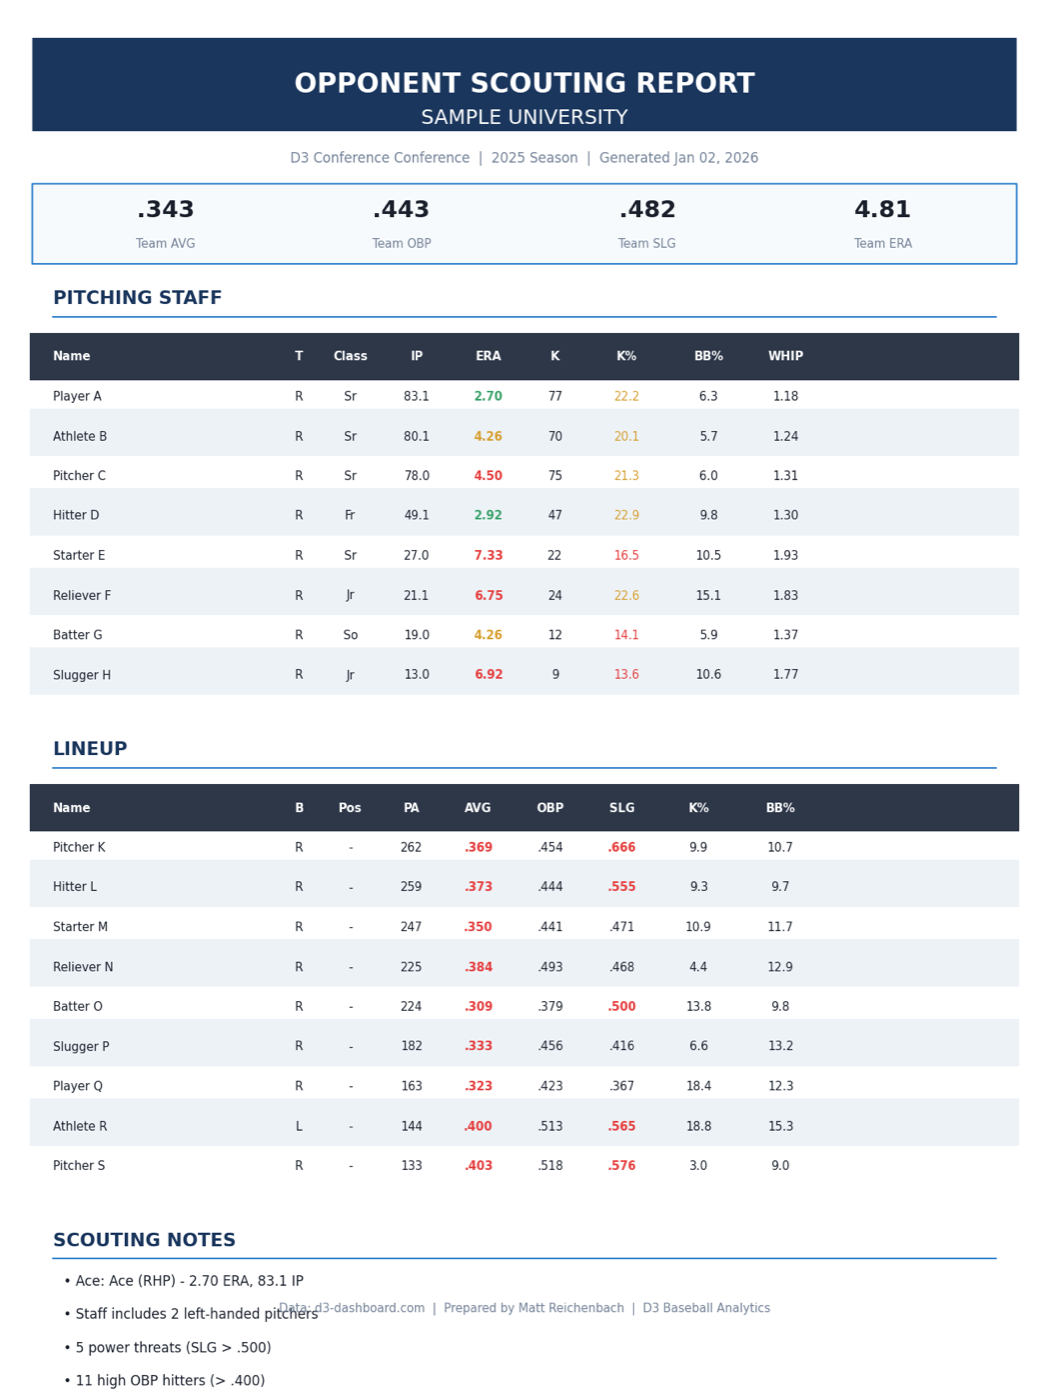
Opponent scouting report, page one
The page a staff reads in the meeting before the series. What a coach looks at first:
- The banner line to size up the opponent in five seconds: team average, on base, slugging, ERA, home runs, steals.
- The hitters table sorted so the bats that decide the game are near the top, with handedness for matchup planning.
- The pitching staff table with ERA, WHIP and strikeout rate, so you know who you get on Friday and who you get in the back end.
- The matchup notes at the bottom: power threats, tough outs, steal threats, and which arms give away free bases.
Open the full sample PDF
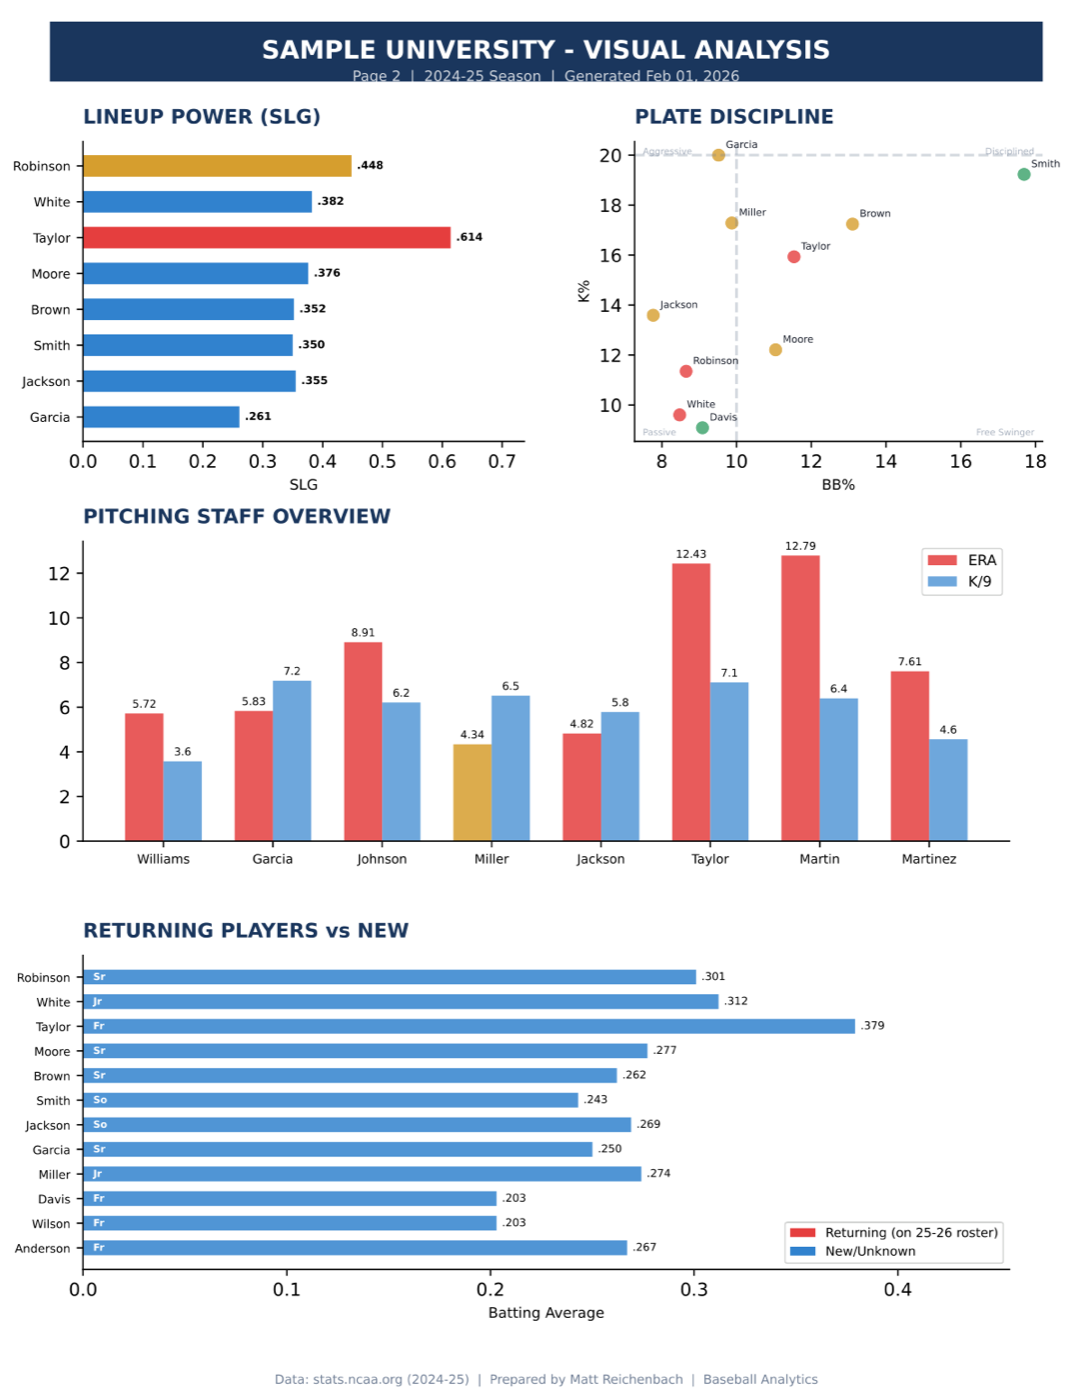
Opponent scouting report, page two
The visual half of the same report. The plate discipline scatter is the one most coaches stop on: hitters in the upper right chase least and walk most, so they are the at bats where you cannot expect a free out. The returning versus new chart tells you how much of last year's book still applies.
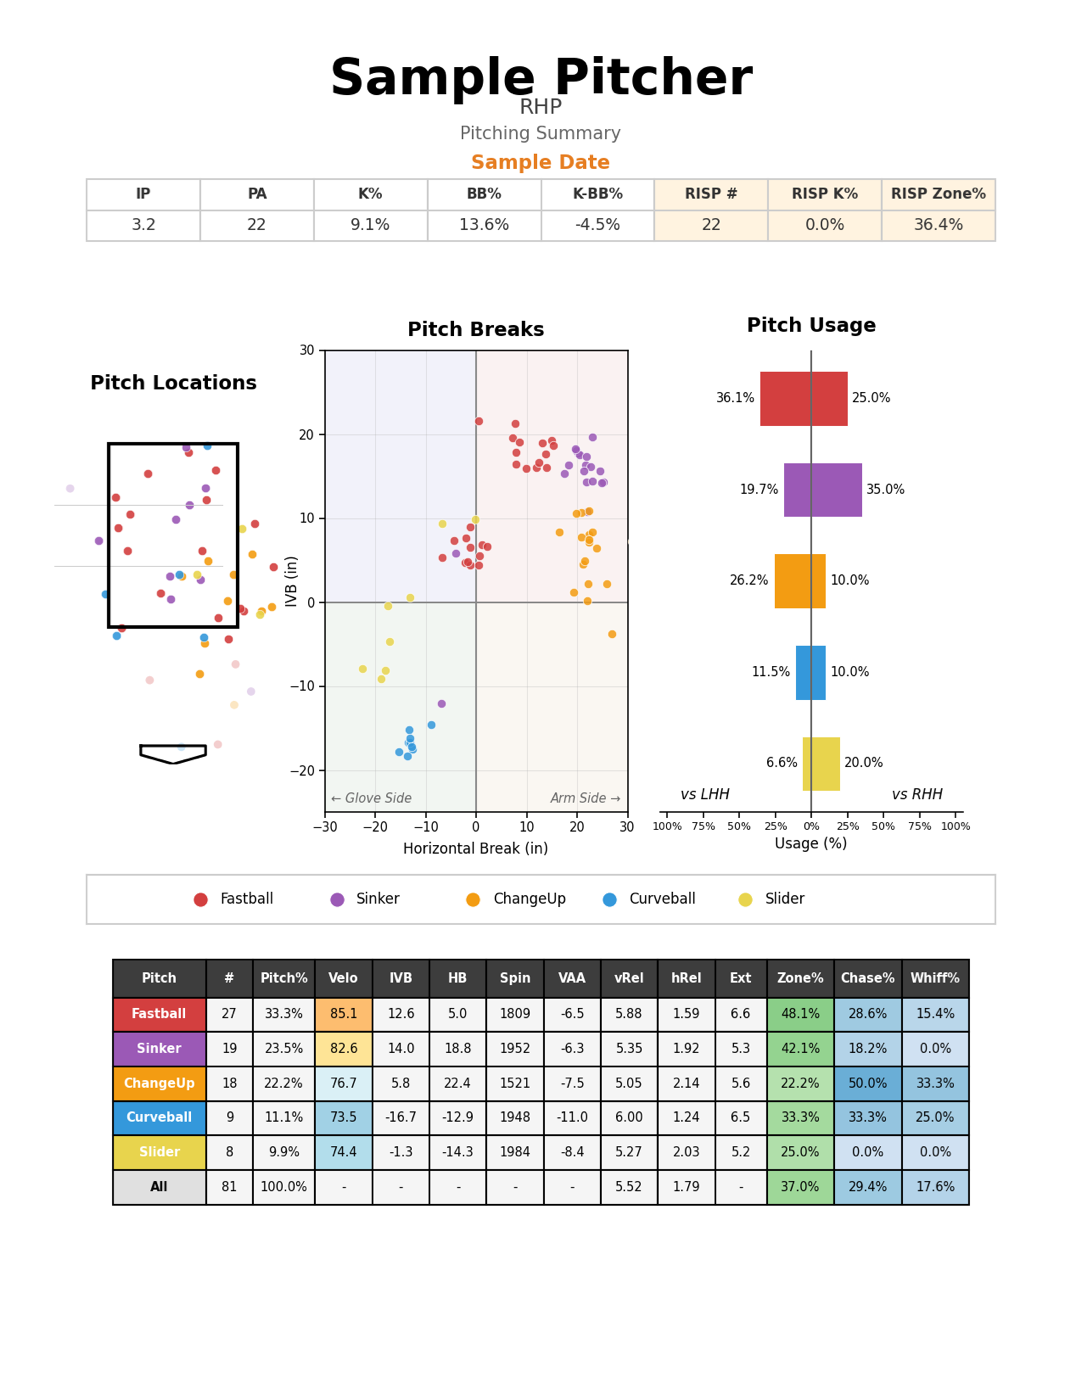
Pitcher summary, one page
The one page you hand a hitter before an at bat. Read the break plot to see how the pitches separate, then the usage bars to see what changes against left handed and right handed hitters. The bottom table carries velocity, in zone rate, chase rate and whiff rate by pitch, so a hitting coach can say plainly which pitch to hunt.
Open the full sample PDF
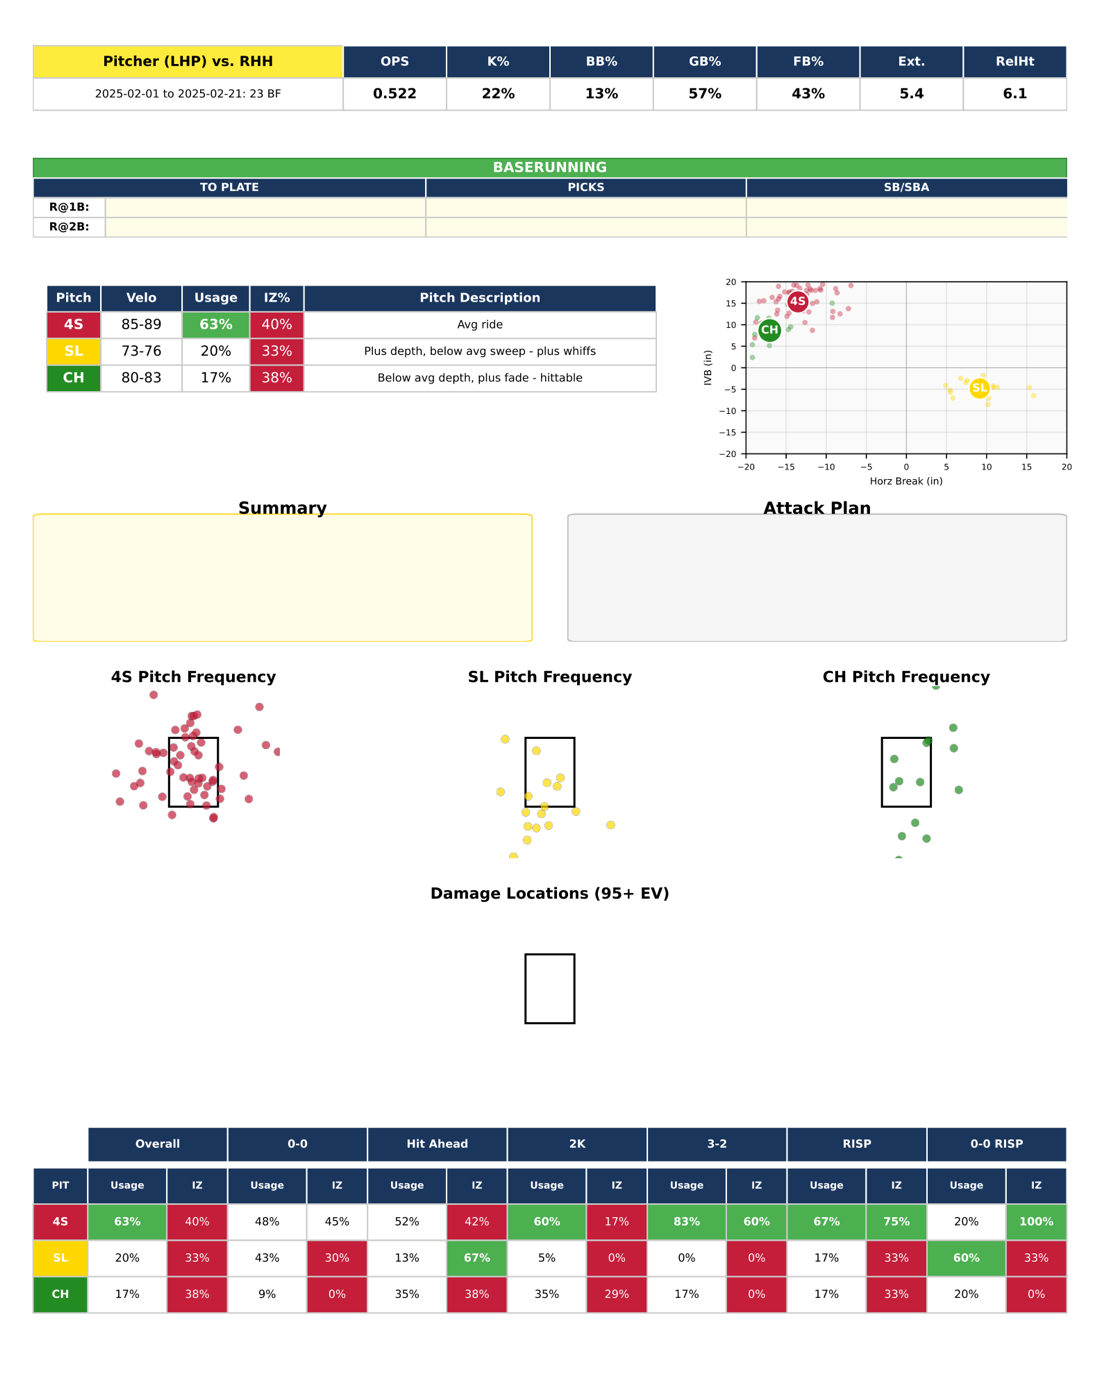
Pitcher splits and usage by count
The deeper version, run separately against left handed and right handed hitters. The count grid at the bottom is the working part: what he throws 0-0, what he goes to when he is ahead, what shows up in two strike counts and with runners in scoring position. The baserunning block up top gives times to the plate and pickoff tendencies for the staff that runs.
Open the full sample PDF
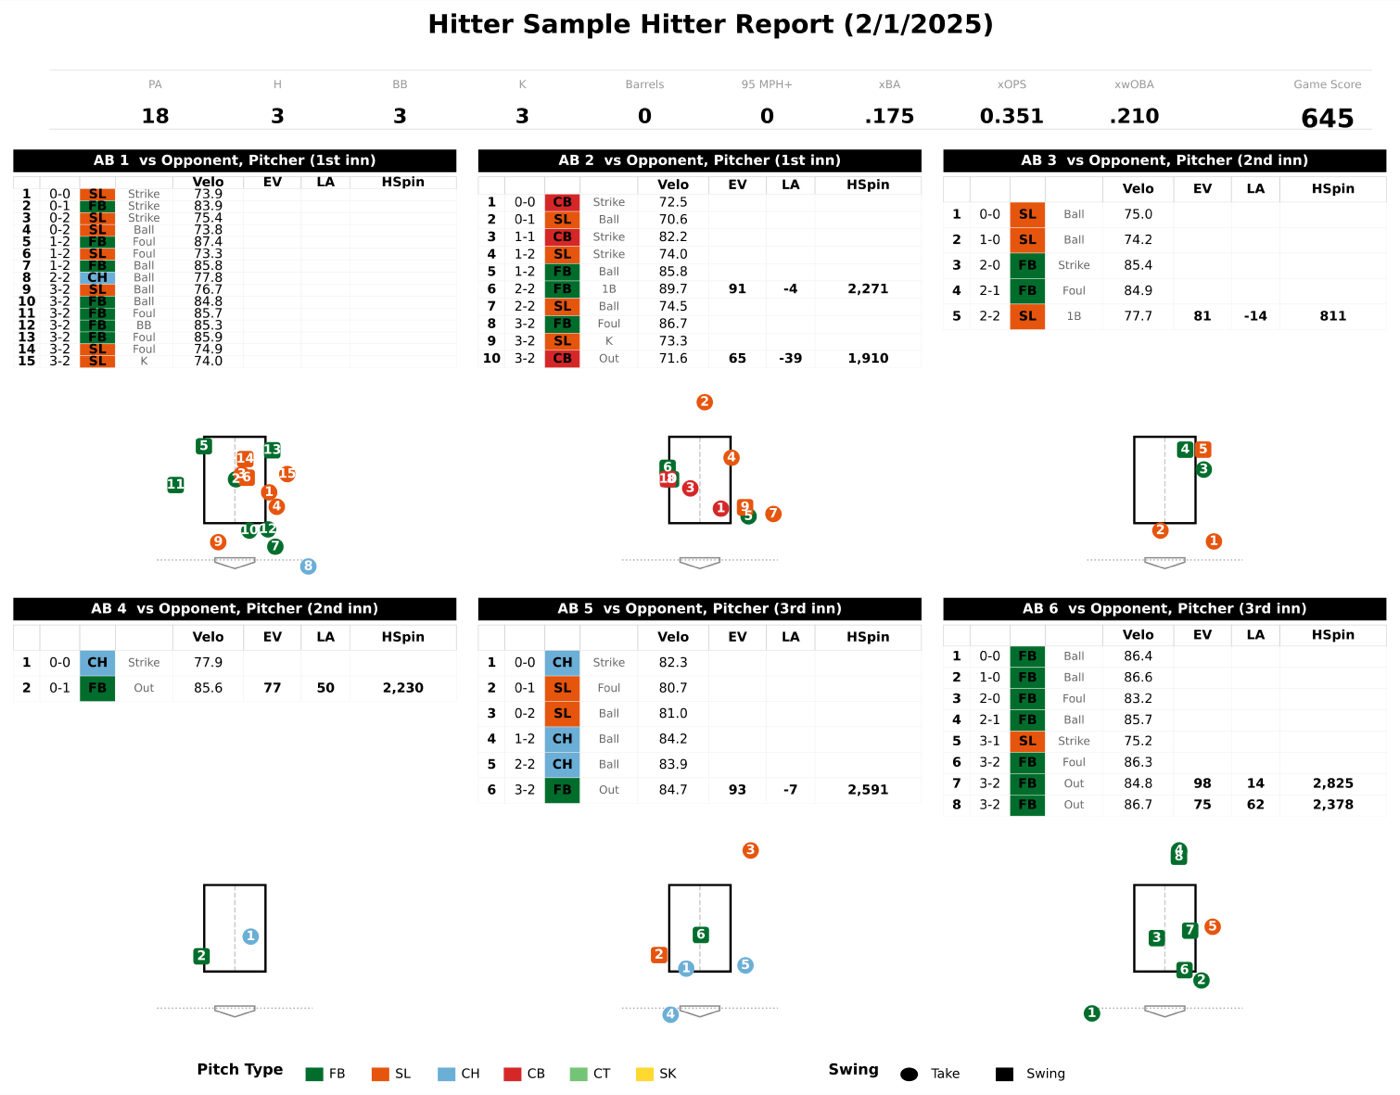
Hitter report, plate appearance by plate appearance
For player development as much as scouting. Each panel is one at bat: the sequence, the result, and where the pitches actually were. Coaches use it to show a hitter the pattern he keeps getting, and to see whether the damage is coming on pitches in the zone or on chase.
Open the full sample PDF
Opponent report from public data only
Not every program has pitch tracking. This version is built entirely from publicly available conference and NCAA numbers, so a staff with no tracking system still gets a real report. Same structure, same notes section, no equipment required.
Want this for your schedule?
Fill out the short form and we will set up a folder for your program.